Overview
This tutorial shows you how to make a plate map that will be compatible with the Nucleus CDK. This is requirement for the platereader analysis tutorial. See this DevNote for more information.
What is a plate map?
A platemap is a file that records what you put on your plate and where.
It is a table, with rows and columns. You can make one using a spreadsheet application like Excel or Google Drive.
Each row represents a well.
Columns provide information that can be used later for quality control or analysis.
Steps
Step 1 - make a blank plate map
Create a blank plate map in the spreadsheet editor of your choice. An example of a basic plate map containing all the required fields is shown below. Plate maps must have the following columns, so that for each well you indicate:
Date— Experiment dateExperiment— a name that gives a brief description of the overall experiment for that wellWell— the alphanumeric location (e.g., K13) of the wellName— a description of what is in the well. For wells that contain the same [material], use the same name.Type— must be one of:SampleStandard— use for FluoresceinControl,Positive ControlorNegative Control
Rxn Volume (uL)— total volume of liquid in well
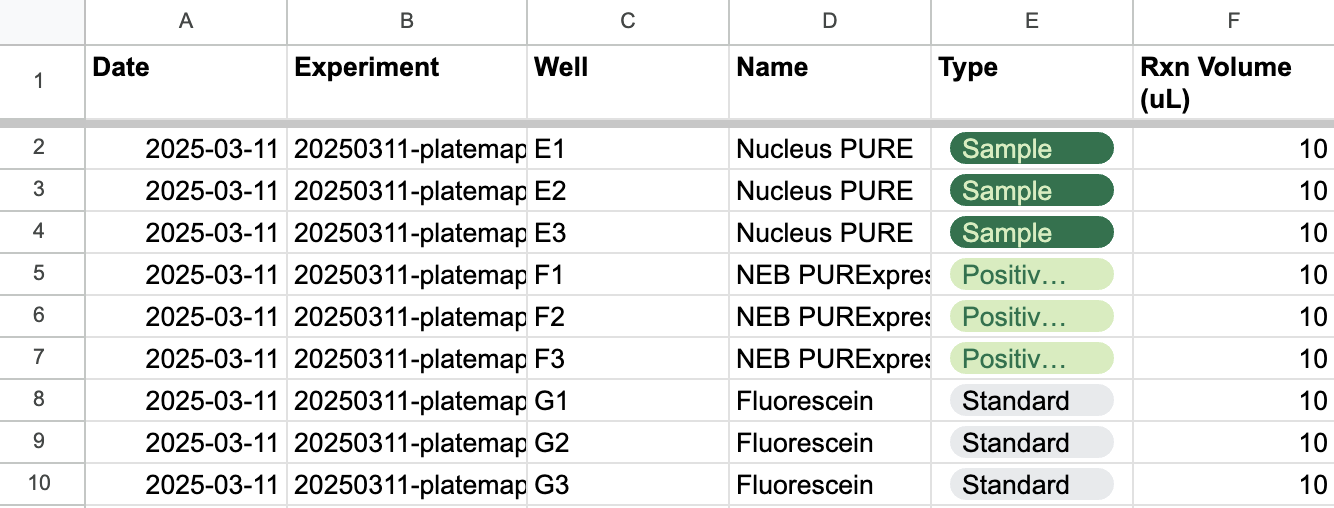
An example of a minimally specified platemap describing a Cytosol experiment.
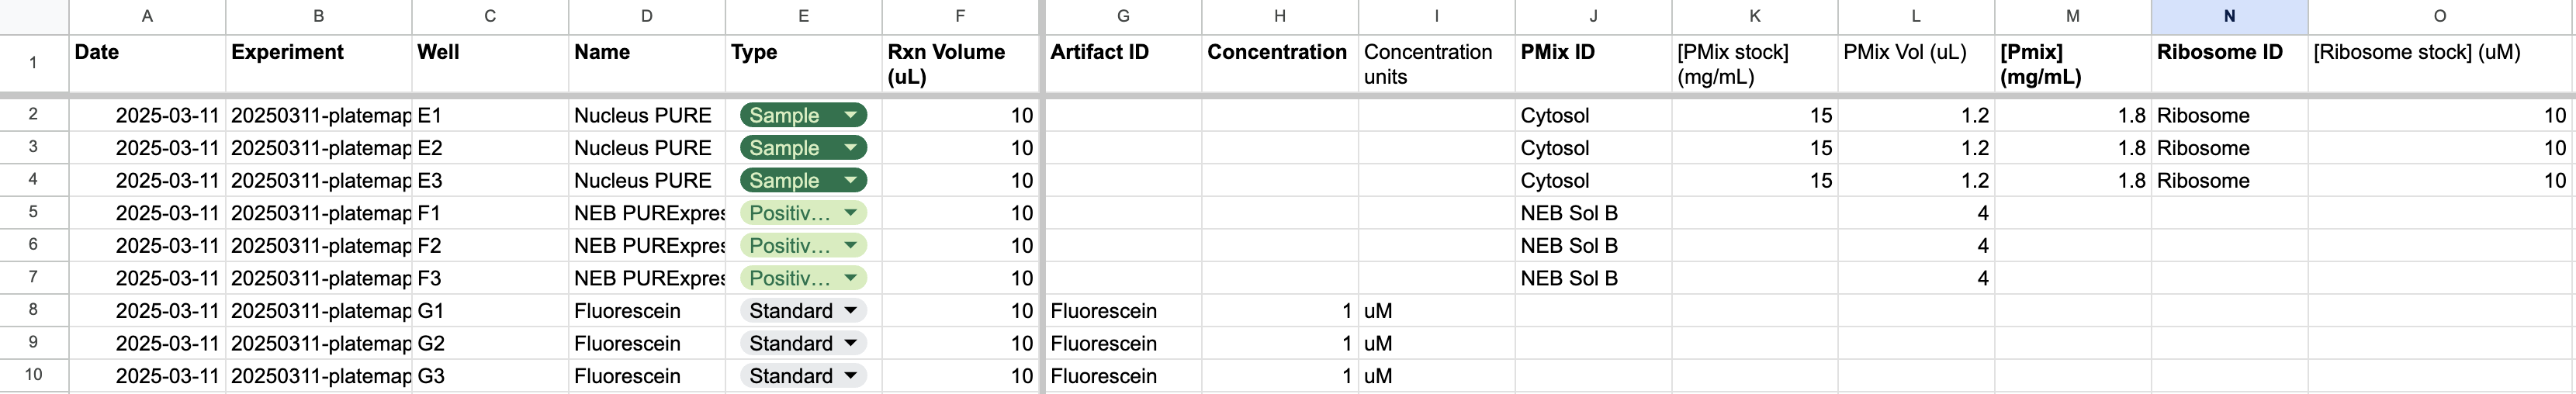
An example of a platemap containing additional columns to represent the composition of each well. We recommend including compositional information in all plate maps.
Example templates
The following link contains three pages that you can use to modify for your own work:
Minimal: this template includes the minimal amount of information needed for compatibility with the CDK.
Recommended: this template includes additional columns to keep track of the components in each well (see below for note on including additional data).
We strongly recommend adding compositonal information to all plate maps.
Step 2 - fill in data
For each well on your plate, add a row to the plate map, filling in as much metadata as you have available. It’s okay to leave blank any column except the mandatory columns in the callout above in step 1.
Including additional data
If you have any additional information you have about what you are plating, consider including it as additional columns. For example, it is often useful to describe the amount of specific materials that are used in your reaction. We often refer to a specific material that might live in your refrigerator as an artifact and give it a unique ID to keep track of it. For example:
<artifact> IDfor material that can be cross-referenced against a specific reagent in your inventory; replace<artifact>with the identity of that material (e.g.,fluorescein stock 2)[<artifact>] (<units>)— indicate concentration (in well, not stock!) with square brackets
Step 3 - export
Export your plate map as a CSV or TSV file and include it in a project directory next to your data files after you run an experiment.